🎨 Illustrated Plotting
This section introduces the built-in Geoscience Illustrated Plotting Module of the software. It covers the classification, management, and extension mechanisms (JSON/ZIP) of the Template Library, provides a detailed analysis of the Plotting Interface layout (Menu Bar, Toolbar, Layer List, Property Panel) and its core operational features (such as data import, layer editing, visual settings, and third-party software integration), and offers a Complete Workflow Guide—from selecting a template to exporting the final plot. 🌍
Objectives
On the Illustrated Plotting page, we will integrate more fundamental geoscience templates, including but not limited to: Tectonic Setting Discrimination Diagrams, Rock Classification Diagrams, and Basic Geothermometer Diagrams. Our ultimate goal is to create a comprehensive plotting toolkit for geosciences to provide maximum convenience for researchers. 🧪
The classification logic for templates is currently organized by academic discipline:
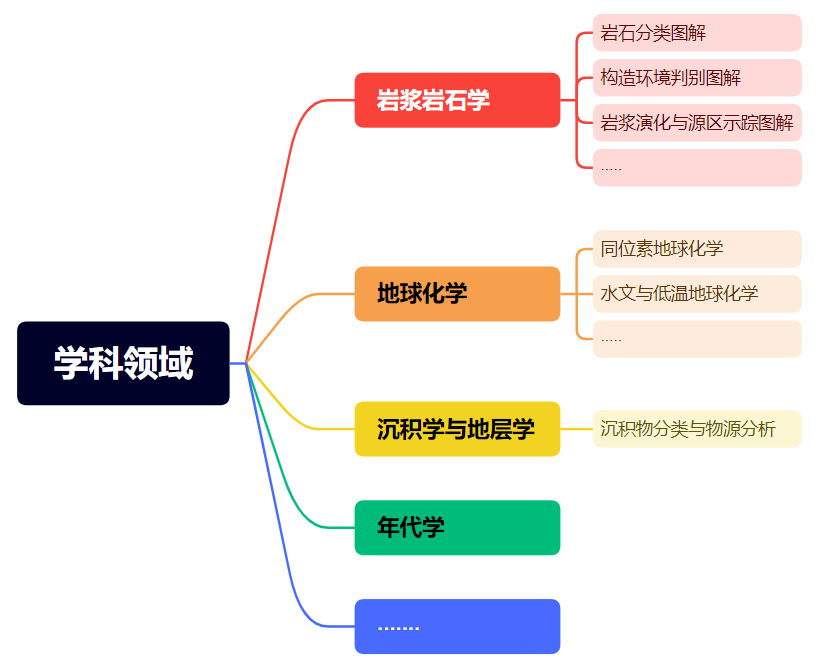
As templates are updated, some classification structures may change.
We welcome valuable feedback during your use to improve the software's usability and convenience. 🌹
Quick Start
Template Library
Main Page
By default, the plotting module displays the built-in Geoscience Template Library upon entry (provided no custom templates are defined). The interface is divided into three main sections:
- Left - Template List: Displays all template hierarchies and corresponding templates, including custom template lists.
- Top Right - Navigation Bar: Updates based on the selected hierarchy in the template list to show different levels of content.
- Bottom Right - Template Cards: Displays the plotting cards under the current hierarchy, including names and preview images.
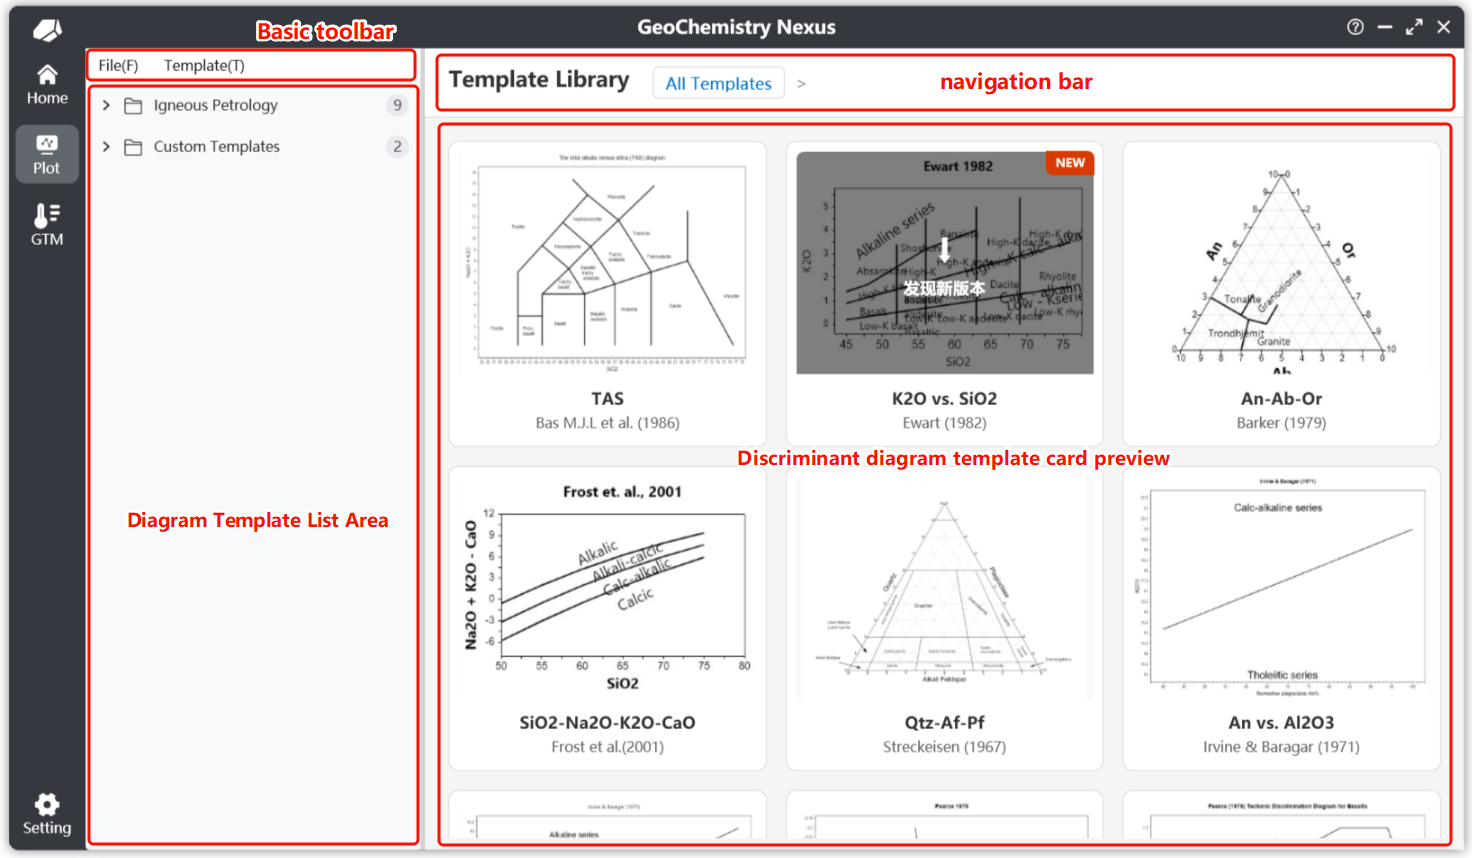
Select and click a template card to enter the specific plotting interface.
These templates are highly extensible. We use the JSON format to store core template information and the ZIP format to package complete resource bundles. With this design, researchers can not only create their own templates but also package and share them with others for rapid reuse.
The system currently supports server-side storage, allowing the template list to be dynamically refreshed without needing a software update.
Under local internet conditions, users can manually check for and update the built-in template list via the menu bar, or enable auto-check in settings to ensure the latest resources.
Menu Bar
Menu bar functions are divided into two main categories:
- File: Primarily for creating, opening, and importing templates.
- New Template: Used to create custom diagrams; clicking this opens an interactive pop-up.
- Open Template: Used to temporarily open a template; supports
jsonfiles andzipresource packages. - Import Template: Used to import external template packages (
zip) into the local custom template list.
- Templates: Primarily for built-in template updates.
- Check for Built-in Template Updates: Used to fetch the latest template lists and updates.
- Check for Classification Structure Updates: Provides recommended built-in classification structures when creating new templates.
Plotting Interface
Layout
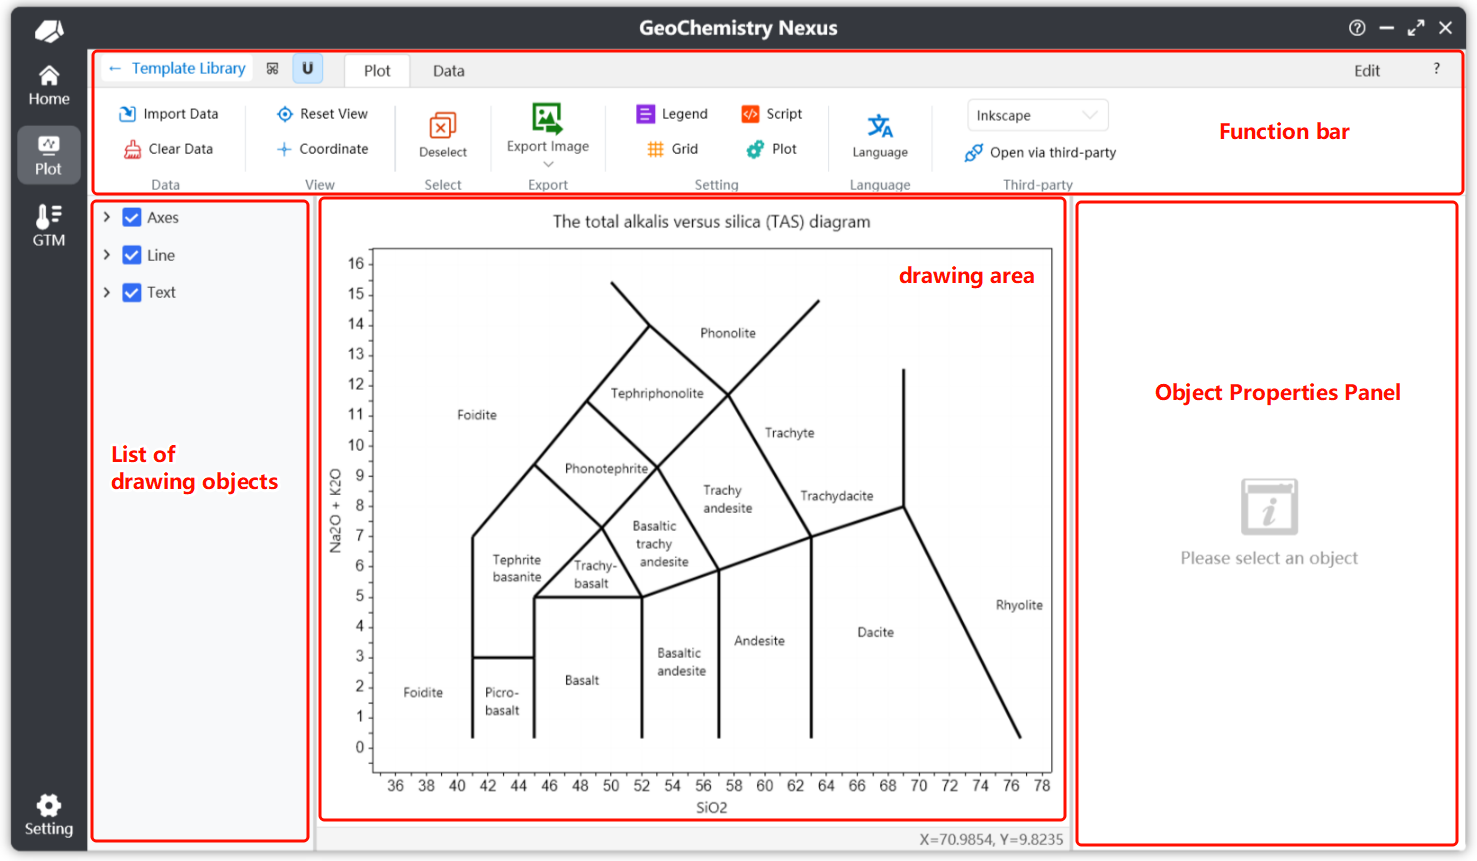
The plotting interface is divided into four main parts:
- Toolbar: Includes shortcut buttons and three functional tabs: Plotting, Data, and Editing.
- Layer List (Objects): A list of drawing elements on the template. Clicking an element allows you to modify its properties.
- Plotting Canvas: The central area for viewing the plot, importing data, visual settings, and viewing template instructions.
- Property Panel: Displays the attributes of the selected drawing element (e.g., color, size) to achieve the desired visual effect.
Plotting Toolbar
The toolbar consists of Shortcut Buttons and a Menu Bar. Shortcut Buttons are for common operations, while the Menu Bar provides specific specialized functions.
By default, the system displays the Plotting Toolbar. General users typically do not need to use the Editing Toolbar—it is an advanced tool used for creating and extending templates.
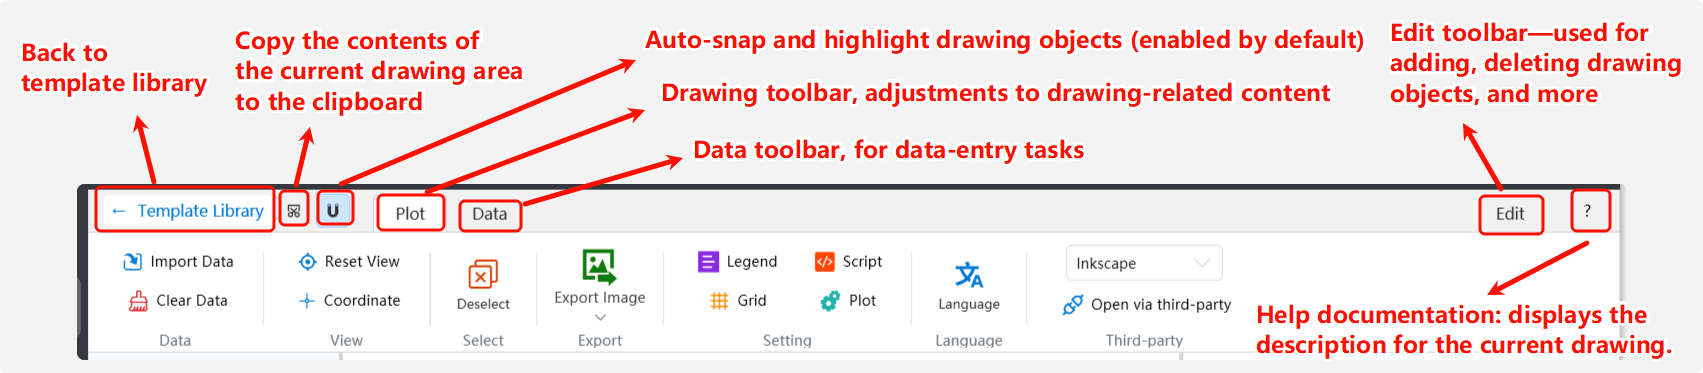
- Shortcuts
- Copy to Clipboard: A quick action located at the top left to copy the current plot as an image.
- Snapping: Enabled by default; highlights objects when the mouse hovers over them for easy selection. If disabled, clicking objects or axes will not automatically show their properties.
- Help: Displays the "Guide" for the current template (if included in the package). It defaults to the software's current language, falling back to English if unavailable.
- Data
- Import Data: Switches to the Data tab. You can also click the Data tab manually.
- Clear Data: Clears all plotted data points without deleting the actual data in the spreadsheet.
- View
- Reset View: Resets the canvas coordinate view to the optimal center.
- Coordinate: Shows/hides the coordinate tracker. When enabled, it displays the real-time mouse coordinates. This is off by default as the status bar now provides this info.
- Selection
- Deselect: Clears the current selection. You can also right-click the canvas to trigger this.
- Export
- Export: Saves the current canvas in formats like
.png,.jpg,.bmp,.webp, and.svg. For research papers, we strongly recommend using the SVG vector format.
- Export: Saves the current canvas in formats like
- Settings: Adjusts canvas properties.
- Legend Settings: Adjusts legend position, arrangement, and visibility.
- Plot Settings: Adjusts plot titles, axis labels, fonts, and colors.
- Script Settings: Manages data calculation rules for the template. Standard users typically do not need to modify this.
- Grid Settings: Configures the canvas grid properties.
- Language: Allows real-time switching of the template language to meet requirements for both domestic and international publication.
- Third-Party: Supports direct integration with third-party design software for advanced post-processing. Currently supports Inkscape, CorelDRAW, and Adobe Illustrator. You can set the application paths in the settings.
Layer List
Drawing elements are categorized into 7 main types:
- Line: Defines basic map boundaries or segments.
- Text: Labels and annotations.
- Polygon: Closed shapes within the plot.
- Arrow: Directional drawing objects.
- Function: Allows users to input custom mathematical functions and domains.
- Axes: Coordinate axes for the plot.
- Data Point: Elements representing imported data.
Default Rendering Order (Top to Bottom): Text > Arrow > Point > Function > Line > Polygon > Axes.
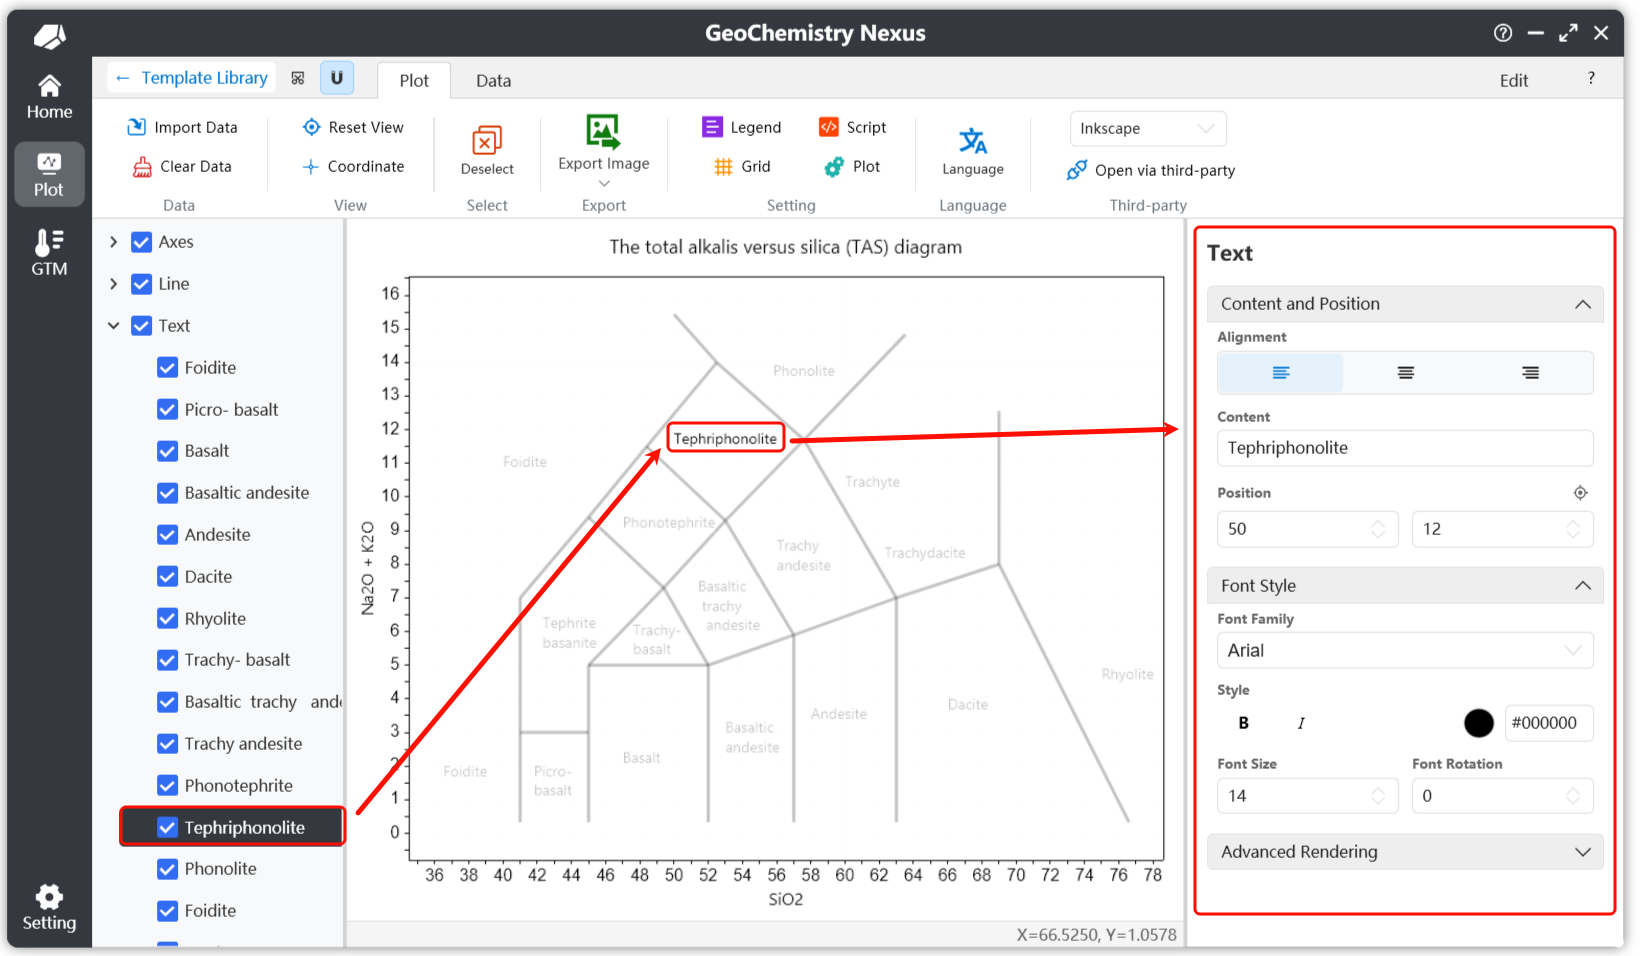
When you select an element in the layer panel, it will be highlighted on the canvas while other elements become semi-transparent to reduce interference. The Property Panel will then display the relevant attributes for that element. 🔍
Modify these properties to achieve your desired visual style.
To deselect all elements, simply right-click anywhere on the canvas or use the Deselect button on the toolbar.
Property Panel & Plotting Guide
The Property Panel is empty if no object is selected. Note that the Property Panel and the Plotting Guide share the same area; they cannot be displayed simultaneously.
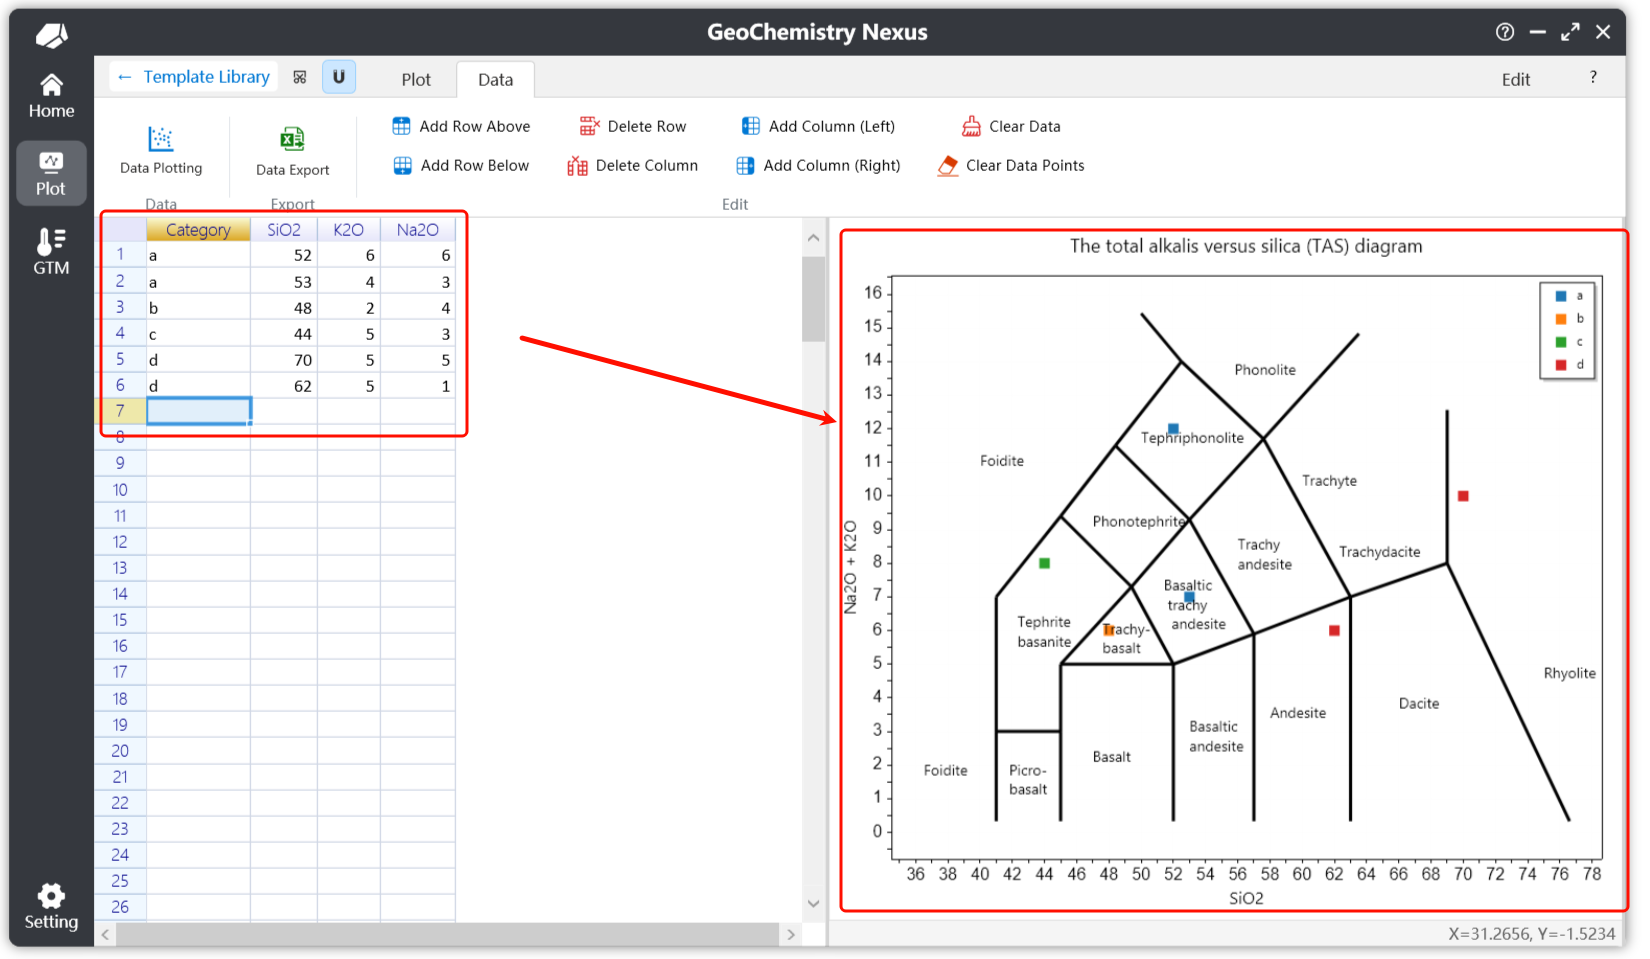
Example Workflow
- Select a template from the Template Library to enter the plotting page.
- Click the Help button (Shortcut) to read the basic information for the template, specifically the Data Import Requirements.
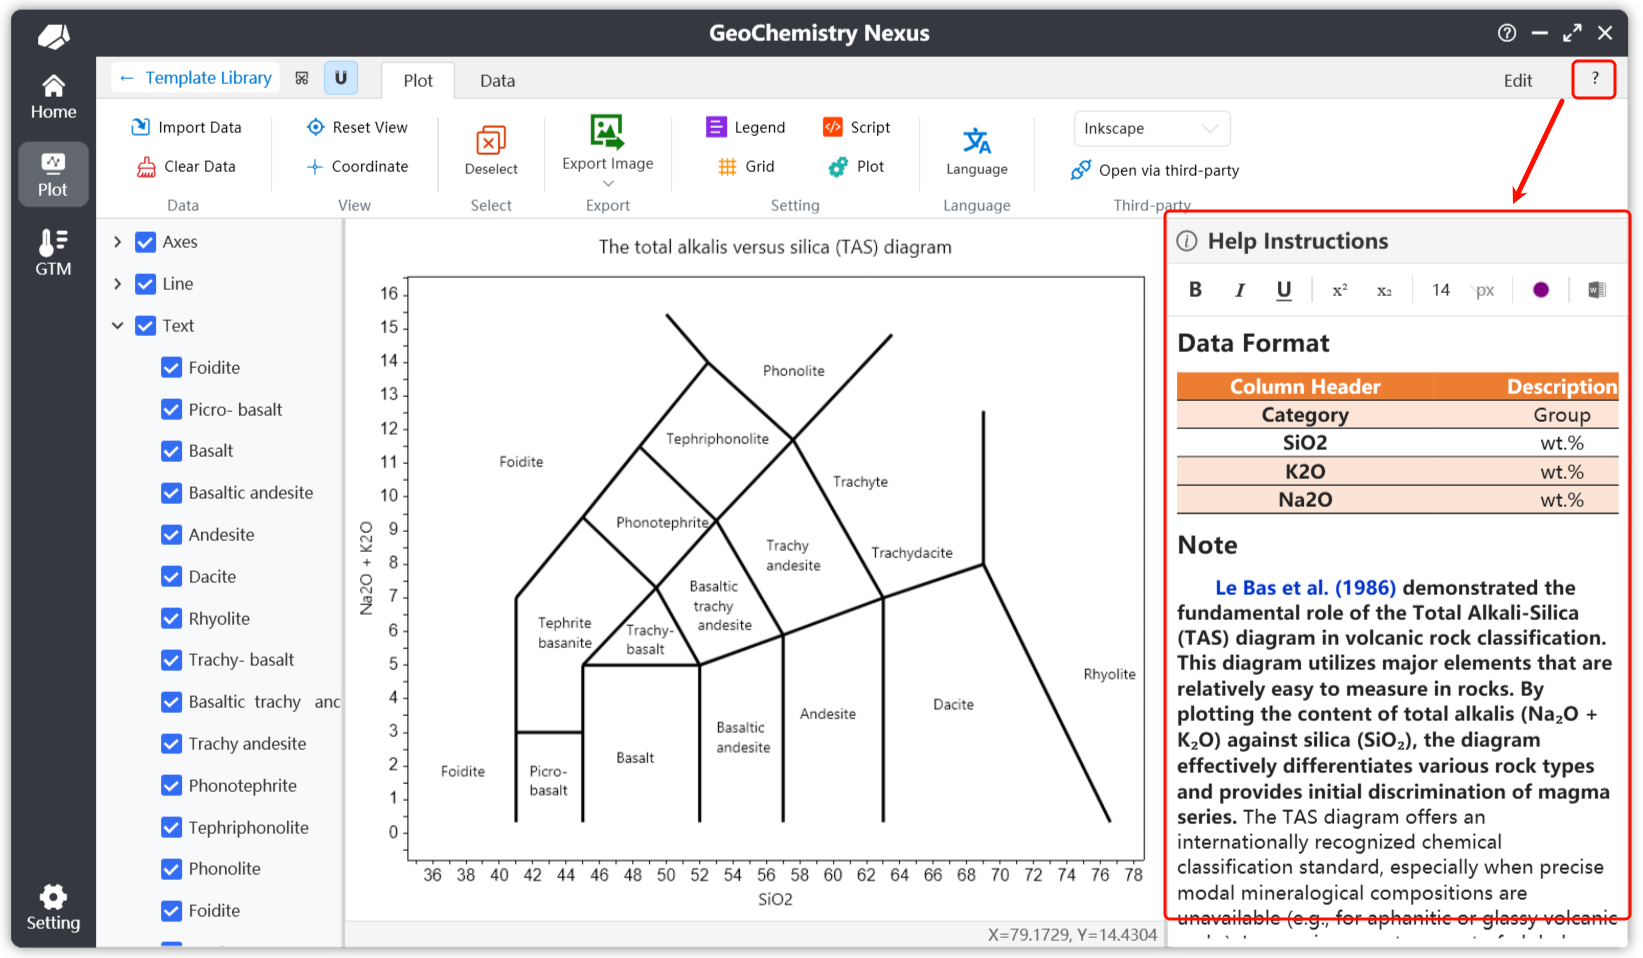 For example, a template might require four columns:
 Category,SiO2,K2O, andNa2O. Units are usually inwt.%. TheCategoryheader is used to group data and generate legends. - Once the requirements are understood, switch to the Data tab and input your data to plot the points. After adjusting visual settings, Export the final result to complete your workflow.